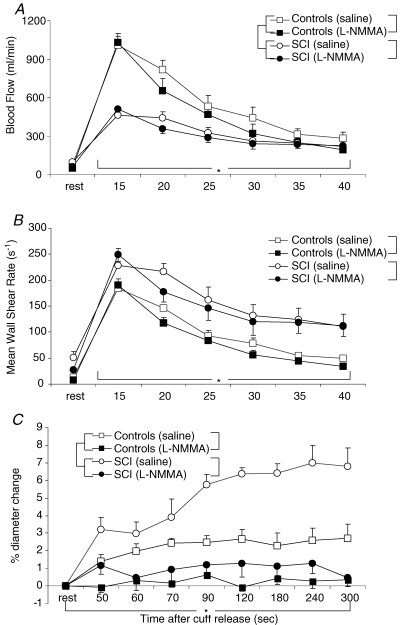
Figure 2. Baseline and post-ischaemic blood flow, mean wall shear rate and superficial femoral diameter.
Average baseline and post-ischaemic blood flow (A) and mean wall shear rate (B) during the first 45 s of reactive hyperaemia, and (C) percentage change in superficial femoral diameter during the post-ischaemic period from minute 1 to minute 5 in controls (squares) and SCI individuals (circles) during infusion of saline (open) or l-NMMA (filled). Data are presented as mean +s.e.m. The brackets represent the ANOVA results. *Significant time effect for both groups (P < 0.05, 2-way ANOVA). †Significant interaction for condition (saline or l-NMMA) × time for both groups separately. ‡Significant between group effect (P < 0.05, 2-way ANOVA). During infusion of l-NMMA no time effect in superficial femoral artery diameter was observed in both groups (1-way ANOVA).

