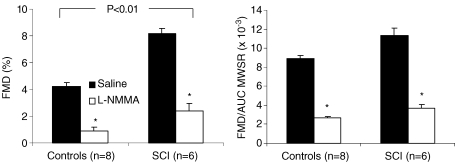
Figure 3. FMD.
FMD presented as: A, maximal relative change in superficial femoral artery diameter, and B, the corrected FMD for the area-under-the-curve of the post-ischaemic mean wall shear rate (AUC-MWSR) in controls and SCI individuals during infusion of saline (filled bars) or l-NMMA (open bars). Results are presented as mean +s.e.m.*Significantly different between saline and l-NMMA at P < 0.05 (Student/s t test).

