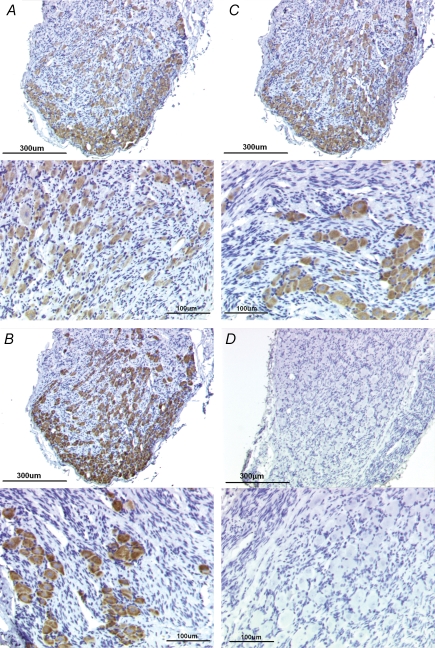
Figure 8. Immunoreactivity for NaV1.7, NaV1.8, and NaV1.9 found in virtually all cells in nodose ganglion.
A, representative low magnification (top) and high magnification (bottom) photomicrograph showing NaV1.7-like immunoreactivity using 1 : 1500 primary antibody concentration. Immunoreactivity was visualized using the chromagen DAG/horseradish peroxidase reaction. Mayer's haematoxylin was used to counterstain the tissues. B, low magnification (top) and high magnification (bottom) photomicrographs showing NaV1.8-like immunoreactivity (1 : 3000). C, low magnification (top) and high magnification (bottom) photomicrographs showing NaV1.9-like immunoreactivity (1 : 1500). D, rabbit IgG isotype control (2.5 μg ml−1). Top and bottom photomicrographs are at low and high magnification, respectively. Bars indicate 300 μm and 100 μm for low magnification and high magnification photomicrographs.

