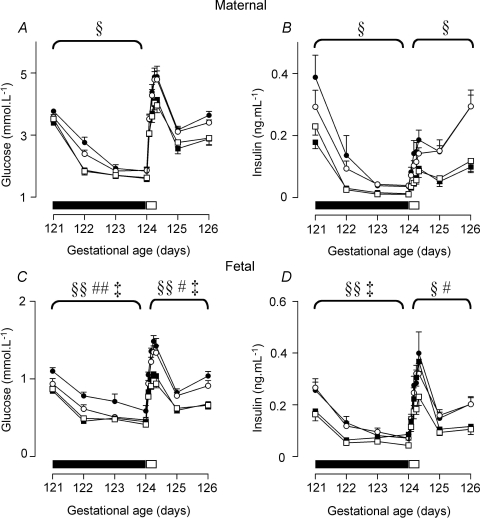
Figure 4. Maternal glucose (A) and insulin (B), and fetal glucose (C) and insulin (D) levels during fasting and refeeding.
Fasting period (days 121–124) indicated by filled bar, glucose infusion indicated by open bar. Data are mean ±s.e.m. PCUN, periconceptional undernutrition. See text for details of nutritional groups. •, singleton N (n = 10); ○, singleton PCUN (n = 12); ▪, twin N (n = 12); □, twin PCUN (n = 10). §P < 0.05; §§P < 0.01 for twin × time interaction; #P < 0.05; ##P < 0.01 for twin × nutrition interaction; ‡P < 0.05; ‡‡P < 0.01 for twin × nutrition × time interaction.

