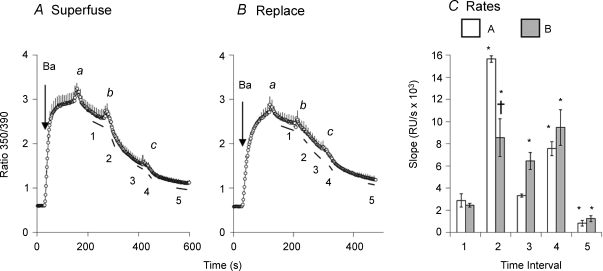
Figure 6. Flow-dependent stimulation of Ca2+–Ba2+ exchange.
A, cells expressing Δ(241–680) were treated with ATP (without Tg) approximately 10 min before beginning the recordings to release Ca2+ from the ER. At 8 min before recording, cells were treated with gramicidin in 20/120 Na/K-PSS. Ba2+ uptake was initiated by applying 1 mm Ba2+ in K-PSS. The labelled points designate the superfusion of 5 ml of K-PSS containing 0.3 mm EGTA (a) or 0.1 mm Ca2+ (b, c). Error bars are shown for every fourth data point (n = 3). B, the experiment follows the same procedure described in A except that at point b, the 0.1 mm Ca2+ solution was applied by the rapid replacement procedure (n = 3). C, slopes of the traces over the intervals designated by the lines beneath the traces labelled 1–5 in panels A and B, as indicated. *P < 0.05 versus slope at time interval 1. †P < 0.05 for data at time interval 2 for superfusion (A) versus rapid replacement (B).

