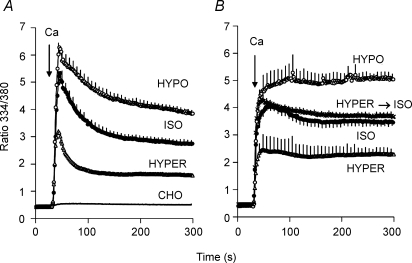
Figure 8. Effect of osmolarity on Ca2+ uptake.
A, gramicidin-treated cells expressing Δ(241–680) were equilibrated with 70/70 Na/K-PSS. Two minutes prior to beginning recording, the medium was changed to 70/140 Na/mannitol-PSS. Ca2+ uptake was initiated by superfusing 5 ml of 0.1 mm Ca2+ in 70/140 Na/mannitol-PSS (ISO), 70 Na-PSS (HYPO) or 70/500 Na/mannitol-PSS (HYPER). (n = 4 for each condition). For the trace labelled CHO, identical experiments were carried out with non-transfected CHO cells. The trace for the non-transfected cells represents the average of duplicate measurements under the isotonic, hypotonic and hypertonic conditions (i.e. n = 6). B, gramicidin-treated cells were equilibrated in 70/70 Na/K-PSS as described above. Two minutes prior to beginning recordings, the medium was changed to either 70/140 Na/mannitol-PSS (ISO, n = 4), 70 Na-PSS (HYPO; n = 3) or 70/500 Na/mannitol-PSS (HYPER, n = 4). NCX activity was initiated by superfusing 5 ml of 0.1 mm Ca2+ in the same media, i.e. 70/140 Na/mannitol-PSS (ISO), 70 Na-PSS (HYPO) or 70/500 Na/mannitol-PSS (HYPER). The hypertonic and hypotonic points were significantly different from the isotonic points (P < 0.05) at all times after 60 s. For the trace labelled HYPER→ISO, the cells were placed in 70/500 Na/mannitol-PSS 2 min prior to beginning recording, and Ca2+ uptake was assayed in 70/140 Na/mannitol-PSS (n = 3).

