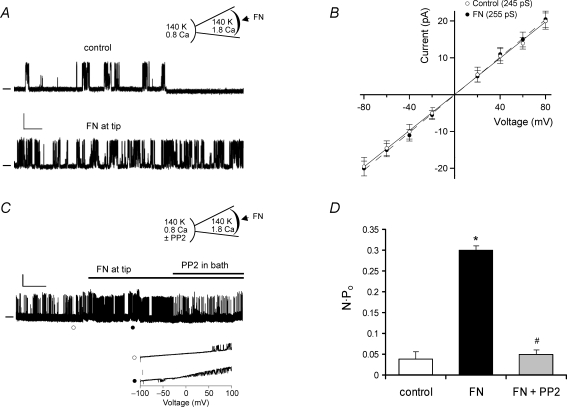
Figure 5. Effect of FN on single-channel BK currents in excised patches.
A, current recording from an excised, inside-out patch at Vh=+60 mV with patch bathed in 140 K+ bath solution containing 0.8 μm Ca2+ (represented by inset diagram). Pipette tip was filled for ∼100 μm with 140 K+ pipette solution containing 1.8 mm Ca2+, 50 nm apamin, 1 μm TRAM-34 and then back-filled with the same solution containing FN (10 μg ml−1). The upper trace (control) was acquired during the first min after gigaseal formation and the lower trace was acquired after ∼5 min, allowing FN time to diffuse to the membrane. Calibration bar: 10 pA, 0.5 s. Zero current level is indicated by dash at left. B, I–V plot from single-channel currents obtained using same protocol as in panel A with current amplitudes measured at ∼1 min and ∼5 min after gigaseal formation at various holding potentials between −80 mV and +80 mV. C, current recording from an excised, inside-out patch at Vh=+60 mV with solutions as depicted in inset diagram. PP2 (1 μm) was added to the bath at ∼5 min. Calibration bar: 10 pA, 1 min. Inset shows current recordings in response to two voltage ramps (from −100 to +100 mV, 1 s duration) performed at times indicated by ○ (upper trace) and • (lower trace). Calibration bar for inset: 20 pA. Conductance of the channel in this patch was estimated to be 233 pS from the lower trace. D, summary data for NPo measurements (mean ± s.e.m.) at +80 mV during control, FN, and FN + PP2 periods. The average conductance was 242 ± 5 pS for control; 237 ± 4 pS for FN and 238 ± 5 pS for FN + PP2, as estimated from voltage ramps as shown in C. For PP3 experiments using the same protocol, the values of NPo were 0.04 ± 0.02 for control, 0.48 ± 0.06 for FN, 0.49 ± 0.07 for FN + PP3. *P < 0.05 versus control. #P < 0.05 versus FN.

