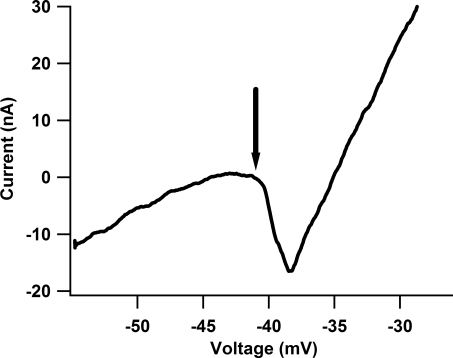
Figure 2. Current–voltage (I–V) relationship for one cell from the cord-intact condition.
During voltage clamp, the PIC manifests as a downward deflection which results in a negative slope region. As the cell is further depolarized, outward conductances are activated which restore the positive slope of the current trace. Since the cell is effectively clamped at the soma, changes in the measured PIC due to synaptic activity must be due to activation or inhibition of voltage-dependent channels on the dendrites. To assess the impact of the PIC on the MRRF, a voltage step to the onset of the PIC (arrow) is applied. For this cell, a 15 mV step was applied (see Fig. 3).

