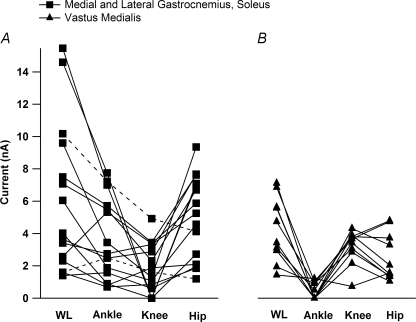
Figure 7. The ΔPT for each joint movement for all MG/LGS and VM cells in the decerebrate, spinalized condition.
A, the ΔPT for MG/LGS (n = 15). On average, the order of ΔPT amplitude for MG/LGS cells was WL > ankle = hip > knee. This represented an increase in the average hip ΔPT as compared to the cord-intact sample (hyperpolarized voltage condition, ANOVA, Bonferroni's correction, P = 0.0001). (Note in only 2/12 cells (dashed lines) was hip ΔPT < knee ΔPT.) B, the ΔPT for VM cells (n = 10). The overall pattern of the ΔPT amplitude was WL > knee = hip > ankle. As with the MG/LGS cells, this represented an increase in the hip IN as compared to the cord-intact sample (ANOVA, Bonferroni's correction, P < 0.002).

