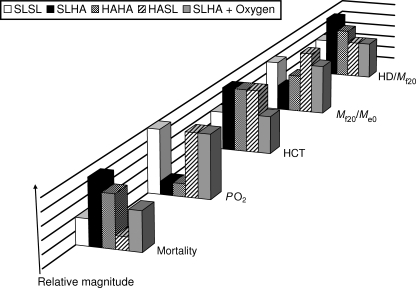
Figure 1. Schematic summary chart of key results of Giussani et al. (2007).
Heights of bars are shown on an arbitrary relative scale to permit graphical comparison of statistically different or similar values from five experimental groups: (i) sea level chick embryos incubated at sea level (SLSL, open bars) or (ii) high altitude (SLHA, black bars), (iii) high altitude embryos incubated at high altitude (HAHA, stippled bars) or (iv) sea level (HASL, hatched bars), and (v) sea level chick embryos incubated at high altitude with oxygen supplementation (SLHA + oxygen, grey bars). Mortality: percentage embryonic mortality at day 20 of incubation period;  : partial pressure of oxygen in chorio-allantoic blood sample, measured in mmHg in the study; HCT: percentage haematocrit in chorio-allantoic blood sample; Mf20/Me0: fetal mass at day 20 relative to initial egg mass at day 0; HD/Mf20: ratio of fetal head diameter to fetal body mass at day 20. Thus, for example, the HCT results show that the value of HCT remained low for SLSL and SLHA + oxygen and that SLHA, HAHA and HASL all showed raised HCT values and that each of the increases was statistically indistinguishable from one another, denoted in the chart by identical bar heights.

