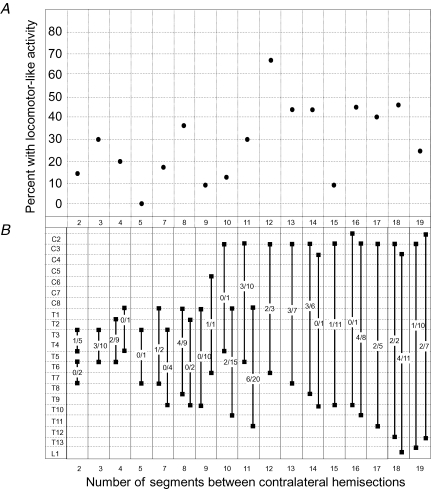
Figure 2. Segmental location of spinal cord hemisections.
A, the percentage success rate of inducing locomotor-like activity is plotted against the number of segments located between staggered contralateral hemisections. Logistic regression analysis indicated no statistically significant correlation, P = 0.261. B, the segmental location of rostral and corresponding caudal hemisections for all preparations is illustrated. Fractions indicate the number of preparations displaying locomotor-like rhythm versus the total number of preparations tested with the specified lesion combination. A preparation with six segments between the two hemisections was not used.

