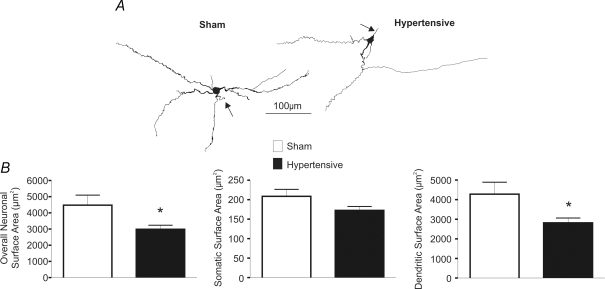
Figure 1. Changes in PVN-RVLM neuronal morphometry in 2K1C hypertensive rats.
A, representative examples of reconstructed PVN-RVLM neurones in sham and hypertensive rats. Axons are identified with arrows. B, summary data of overall neuronal, somatic and dendritic surface areas (n = 24 sham and 27 hypertensive neurones). Note the reduction in the overall neuronal and dendritic surface area in PVN-RVLM neurones in hypertensive rats. *P < 0.05.

