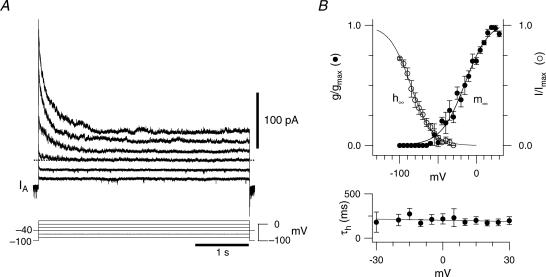
Figure 5. Biophysics of IA in inspiratory neurons.
A, the voltage dependence of activation measured from difference currents evoked by depolarizing step commands delivered from −100 mV and −40 mV in an outside-out patch. The voltage-clamp protocols are shown superimposed and alternating traces were eliminated to facilitate illustration. B, steady-state activation curve (m∞) and inactivation curve (h∞) from outside-out patches (top). The time constant of inactivation (τh) as a function of voltage (bottom).

