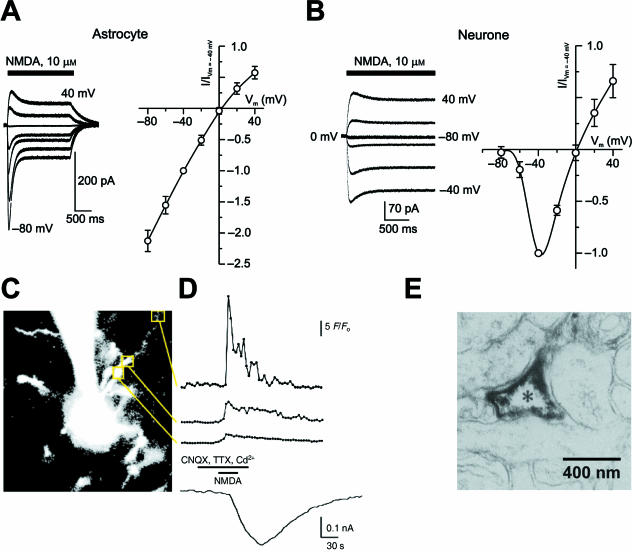
Fig. 3.
NMDA responses in astrocytes and in neurons. (A,B) Comparison of NMDA activated currents and corresponding I–V curves measured from an astrocyte (A) and a neuron (B) acutely dissociated from the same mouse cortical slice. The recordings were performed in normal physiological solution, containing 1 mm Mg2+. Note clear voltage-dependent relief from Mg2+ block in neurons vs. linear I–V curve in astrocytes. (C) A cell with the morphological features of an astrocyte was dialysed with Fluo-4 via the patch pipette in a cortical slice acutely isolated from a non-transgenic FVB/N mouse. Note the recording pipette approaching the cell from top. Changes in fluorescence (F/Fo) were analysed in the areas delineated by squares and are displayed in the top three traces in D; the lower trace shows simultaneously recorded membrane current response. NMDA (100 µm), CNQX, TTX and Cd2+ were applied as indicated. The largest fluorescent intensity changes, i.e. the highest Ca2+ influx, demonstrates high level of NMDA receptor expression in distal astroglial processes rather than in somatic regions. (E) Immunoelectron micrograph visualizing the expression of the NR1 subunit in astroglial processes of the rat cortex. A, B: reproduced from Lalo et al. (2006); C, D: modified from Schipke et al. (2001); E: modified from Aoki et al. (1994).

