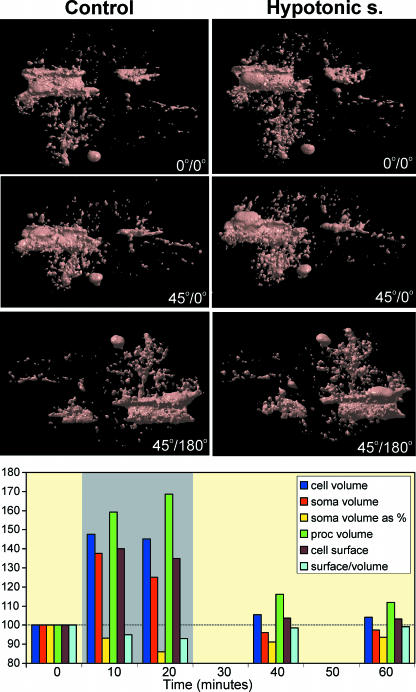
Fig. 3.
Effect of hypotonic solution on the morphology and morphometric parameters of GFAP/EGFP astrocytes in situ. An example of morphological changes evoked by a 10-min application of hypotonic solution (200 mmol kg−1) on a surface-rendered GFAP/EGFP astrocyte. Surface rendering of the astrocyte before the application of hypotonic solution (left) shows a complex cell morphology. Hypotonic solution (right) evoked an increase in total cell volume (swelling). Similarly, the volume of some cell compartments increased, while other cell compartments did not change and yet others decreased in volume or were rearranged. The graph shows the effect of a 20-min application of hypotonic solution (200 mmol kg−1) on total cell volume, process volume, soma volume, soma volume expressed as a percentage of the total cell volume, cell surface area and the surface to volume ratio expressed as 2√S/3√Vof the cell shown above. The time of application of the hypotonic solution is indicated by the grey rectangle. Graph was constructed using real-time relationships.

