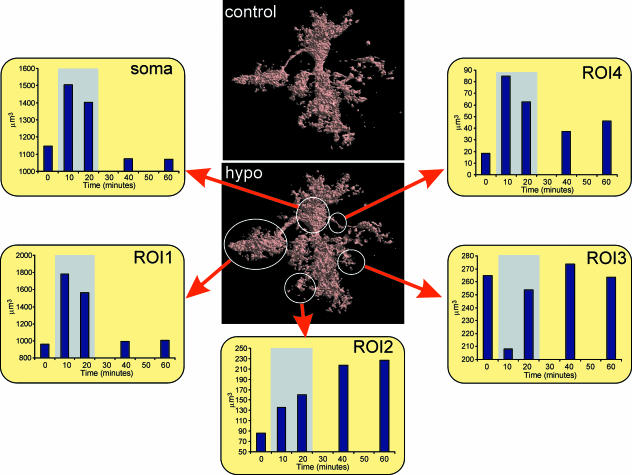
Fig. 4.
Effect of hypotonic solution on the volume of GFAP/EGFP astrocyte compartments. The volume of the cell soma and various cell compartments during and after the application of hypotonic solution (200 mmol kg−1). The following cell compartments were analysed: soma, cell domain attached to the cell soma by one process (ROI1), cell process directly attached to the soma (ROI4) and two distant cell processes (ROI2, ROI3). The time of application of the hypotonic solution is indicated by the grey rectangle. Data were normalized and corrected for the decrease in the signal produced by photobleaching. Graphs were constructed using real-time relationships.

