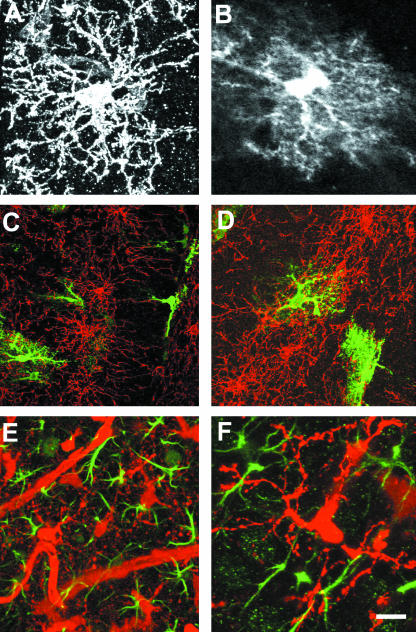
Fig. 2.
Morphology and distribution of NG2-glia and astrocytes. Confocal microscopic images of mid-sagittal sections of P15 brains from NG2-DsRed mice (A,E,F) and GFAP-EGFP mice (B–D), immunolabelled for NG2 (C,D) or GFAP (E,F). (A,B) NG2-glia and protoplasmic astrocytes are superficially similar, but differ in the organization of their process arborizations and structure. (C,D) Immunolabelled NG2-glia (red) are a separate and distinct population from EGFP+ protoplasmic astrocytes (green). The process domains of NG2-glia and protoplasmic astrocytes overlap with each other. (E,F) GFAP immunolabelling was not observed in DsRed+ NG2 glia; note the DsRed+ blood vessels in E. Scale bar = 25 µm in C,D and 10 µm in A,B,E,F.

