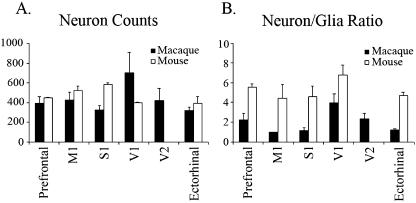
Fig. 2.
Average (± SEM) (A) neuronal cell count, and (B) neuron/glia ratio in mouse and macaque. Data were obtained from three radial strips in each functional region (except M1 of macaque, n = 2). The variation of cell count in different functional regions is greater than previously reported, and one-way anova analysis indicates that there are significant differences between regions in the neuronal cell count in mouse (P < 0.005).

