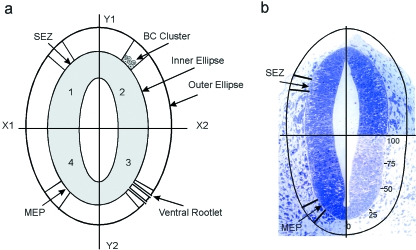
Fig. 1.
Method of determining cell density in the regions of the presumptive MEPs and SEZs. (For details see Text). (a) Diagrammatic representation of transversely sectioned neural tube (shaded), with a pale lumen and bounded by the presumptive glia limitans (inner ellipse). (b) Transverse section of a rat E11 neural tube prior to rootlet emergence. The outer ellipse is shown, 80 µm above the neural tube surface.

