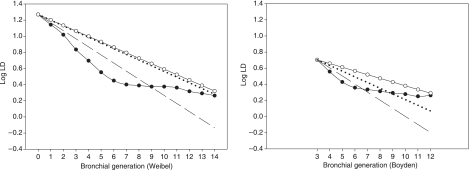
Fig. 2.
Plots of mean lumen diameter over all subjects on a logarithmic scale (log LD) against bronchial generations according to Weibel's model (left graph) and Boyden's classification (right graph). Black circles: log of measured LD; open circles: log of theoretical LD calculated with the mean measured HR; dashed line: log of theoretical LD calculated using an HR value of 0.79 (Weibel); dotted line: log of theoretical LD calculated using an HR value of 0.85 (Mauroy).

