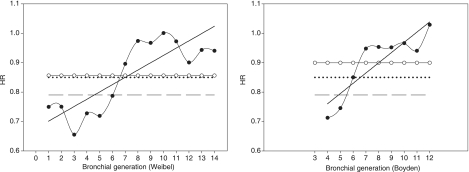
Fig. 3.
Plots of mean homothety ratio over subjects (HR) against bronchial generations according to Weibel's model (left graph) and Boyden's classification (right graph). Black circles: measured HR, solid line: linear regression of the latter curve; open circles: mean measured HR; dashed line: HR value of 0.79 (Weibel); dotted line: HR value of 0.85 (Mauroy).

