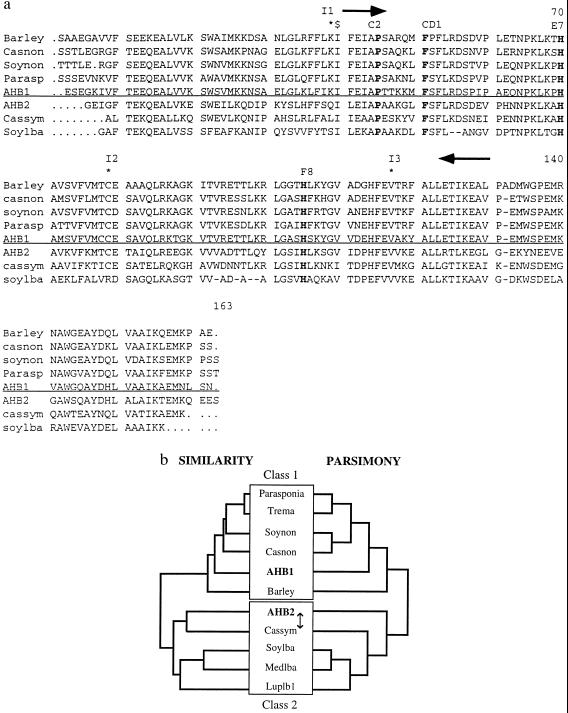
Figure 1.
(a) Alignment of some plant hemoglobin protein sequences. Proximal and distal histidines, phenylalanine CD1, and proline C2 are shown in bold. The location of primers used to amplify AHB1 PCR fragment are shown as arrows. $ represents the 5′ end of the AHB2 cDNA (Clone ID 11161). Intron positions are marked with stars and labeled I1-I3. Class 1 and 2 hemoglobins are separated by the horizontal line. (b) Cladistic analysis of plant hemoglobins. The left tree is a similarity tree of plant hemoglobin protein sequences created using the Genetics Computer Group pileup program. Class 1 and 2 hemoglobins form two distinct clades. The right tree is one of the two most parsimonious trees (CI .855, RC .654) generated by an exhaustive search of all possible trees using the paup, Ver. 3.1.1 program. The two trees of maximum parsimony differed in whether they grouped the Casuarina symbiotic hemoglobin or AHB2 with the leghemoglobins (represented by the arrow). The bootstrap value for the basal branch of this tree is 100%. The two classes of plant hemoglobins are highlighted by boxes. Hemoglobins (and GenBank accession numbers): barley: barley nonsymbiotic hemoglobin (U01228); casnon: Casuarina nonsymbiotic hemoglobin (X53950); soynon: soybean nonsymbiotic hemoglobin (U47143); parasp: Parasponia hemoglobin (U27194); AHB1: This study (U94998); AHB2: this study (U94999); cassym: Casuarina symbiotic hemoglobin (77695); soylba: soybean leghemoglobin A (J01299); medslba: Medico sativa leghemoglobin A (X14311); luplb1: lupin leghemoglobin 1 (Y00401).

