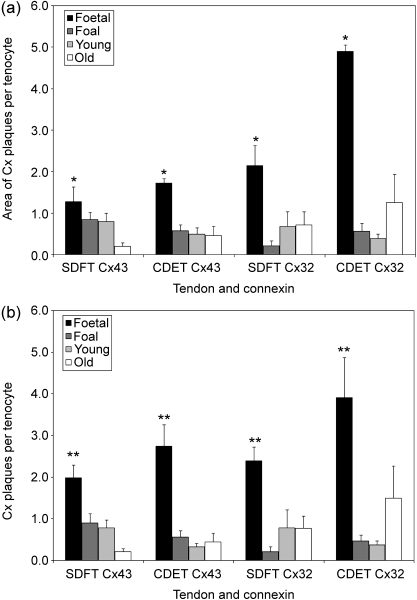
Fig. 6.
(a) Total area of Cx32 and Cx43 plaques per tenocyte (expressed per µm2) in the SDFT and CDET from each age group. Asterisk indicates a significant difference compared with all other age groups. The mean area of Cx plaques per tenocyte was significantly higher in the fetal group than in any other group for both Cx43 and Cx32, but did not differ between the SDFT and CDET. Error bars are indicated as ±SEM. (b) Cx32 and Cx43 plaque number per tenocyte (expressed per mm2) in the SDFT and CDET from each age group. Double asterisk indicates a significant difference compared with all other age groups. The number of Cx plaques was significantly higher in the fetal group than in any other group for both Cx43 and Cx32, but did not differ between tendons.

