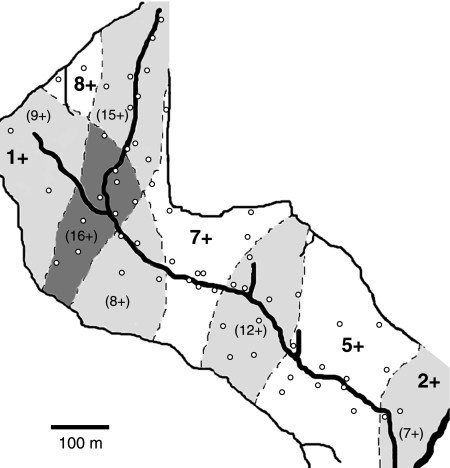
Fig. 1.
Schematic diagram of RSHG showing distribution of birds (estimated from encounters with 23 radio tagged individuals) and sampling sites. Open circles represent sampling quadrants. Thick lines represent the gully floor/streambed; thin lines represent the ridge-lines which bound the gully and define the study site. Dotted lines signify the generalised home range boundaries of Apteryx. Near neighbours with highly overlapping ranges have been grouped together, and their ranges are represented by shared boundary lines. The large numbers indicate the number of tagged individuals using each grouped range. Shaded areas represent areas of overlap between the ranges of neighbouring groups of birds, and the numbers in parentheses show the maximum number of birds using these shared areas (calculated by adding together the numbers of birds in each of the ranges which contribute to the shared area). The + sign indicates that an unknown number of untagged birds also use the area.

