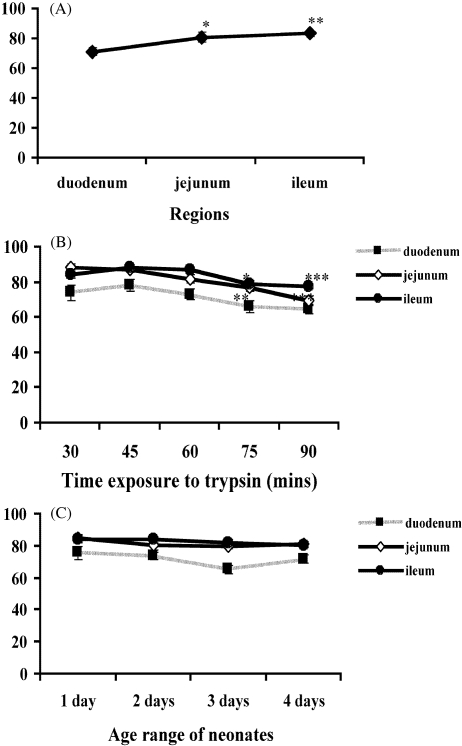
Fig. 2.
Percentage of viable cells obtained from the duodenum, jejunum, and ileum (A). Percentage of viable cells harvested at varying trypsin dissociation times taken from different intestinal regions (B). Percentage of viable cells taken from different age range of neonates (C). Each point represent the mean ± SE; n = 16 (A,B) n = 4 (C). *P < 0.05, **P < 0.01 and ***P < 0.001 taken as significant differences in the group.

