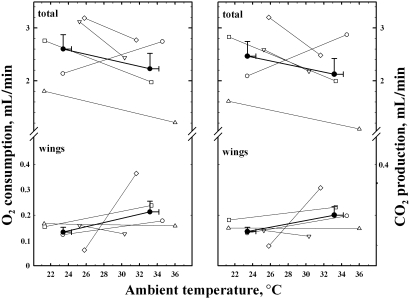
Fig. 6.
Graphs showing V˙O2 (left panel) and V˙CO2 (right panel) of the total body and of the wings, each measured at two temperatures. Unfilled symbols (thin lines) refer to different bats. Filled symbols (thick lines) refer to the mean values of the group, with bars indicating 1 SEM. Note that for clarity, the Y-axis has a different scale below and above the break. At the higher temperature, in most cases total V˙O2and V˙CO2 decreased, whereas the gas exchange attributed to wings, on average remained almost constant.

