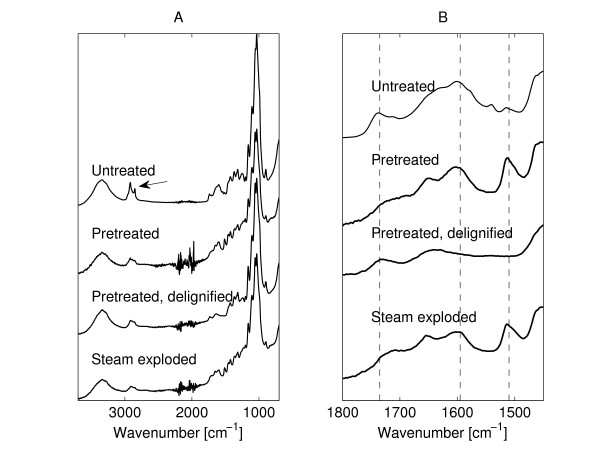
Figure 1.
Spectroscopy. ATR-FTIR spectra of untreated, hydrothermally pretreated, delignified hydrothermally pretreated and steam-exploded wheat straw. (A) Complete spectra of all treatments. (B) Excerpt of spectra. All spectra are separated to ease comparison. The arrow in A points to the bands at 2850 and 2920 cm-1 (CH2- stretching bands ascribed to wax). The vertical lines in B mark the positions of the bands at 1735 (carbonyl, ascribed to hemicellulose), 1595 and 1510 cm-1 (aromatic ring stretch, ascribed to lignin).

