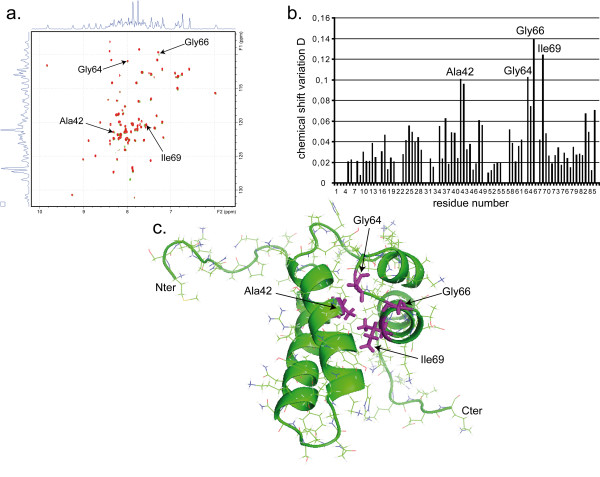
Figure 3.
Chemical Shift Perturbation analysis of the 8 kDa domain upon pamoic acid binding. a. Superposition of 2D 15N-1 H HSQC spectra of the 15N-labeled 8 kDa domain recorded without (green peaks) and with (red peaks) a 4-fold molar excess of pamoic acid. The four most perturbed residues crosspeaks are annotated. b. Histogram of chemical shift variation D upon binding to pamoic acid. Ala42, Gly64, Gly66 and Ile69, which showed a significant D value, higher than 3-times the standard deviation, are indicated. c. Mapping of the four residues Ala42, Gly64, Gly66 and Ile69 on the structure of the 8 kDa domain. Sidechains of amino-acids shown by Chemical Shift Mapping to be involved in the interaction are colored in magenta. The orientation of the molecule is the same as that in Figure 1. The picture was prepared with PyMOL [48].

