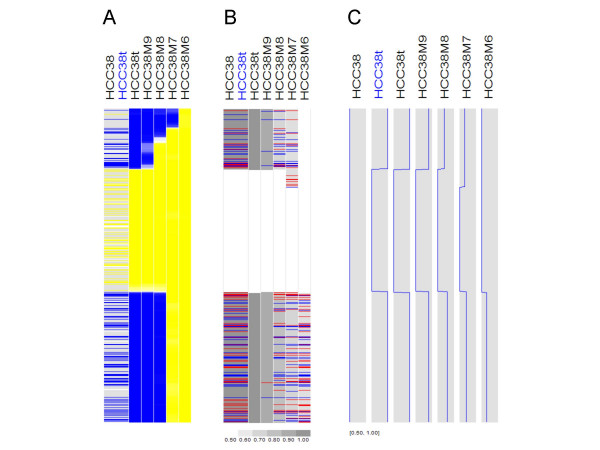
Figure 7.
Comparing LOH and MCP using the 10 K mixing samples. The inferred LOH (A) and MCP (B, C) are displayed for chromosome 4. In the tumor-only LOH inference (the columns except column 1 in A), the inferred probability of LOH is displayed using a blue (1 – 0.5) to white (0.5) to yellow (0.5 – 0) color scale. See legends of Figure 2 for additional color schemes.

