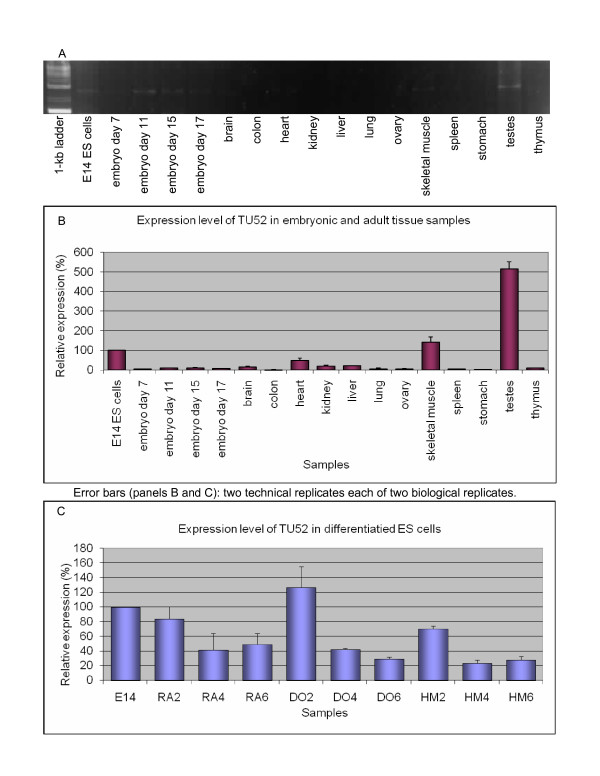
Figure 5.
Expression profile of TU52, an intergenically spliced product of the Clk2-Scamp3 locus. A. Qualitative RTPCR. B. Quantitative RTPCR: whole-embryo and tissue panel. C. Quantitative RTPCR: retinoic acid (RA), dimethyl sulfoxide (DO), and hexamethylene bisacetamide (HM)-induced differentiation time courses of E14 ES (left to right: untreated; days 2, 4, 6).

