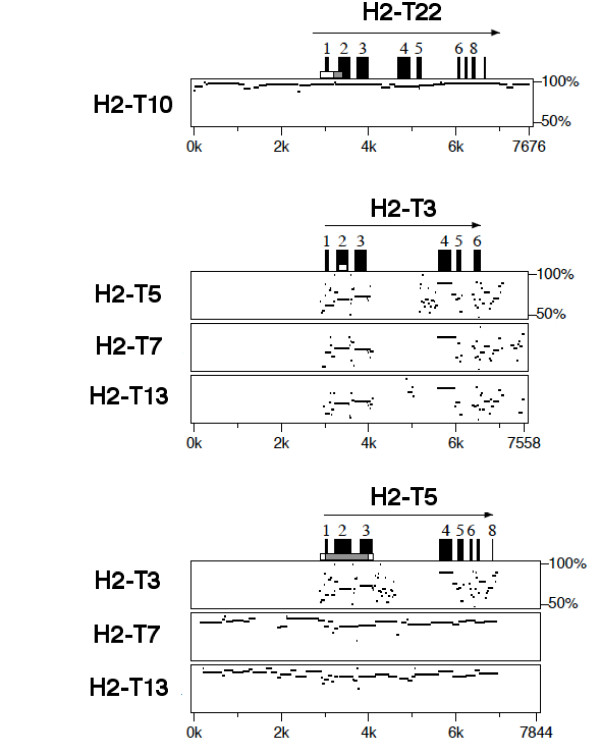
Figure 3.
PipMaker analyses of genomic sequences of mouse H2-T genes. PipMaker analyses were performed to detect similarity within the promoter region. Sequences used for comparison include 3 kb of 5' upstream region and 1 kb of 3' downstream region of coding sequence for each gene. Exons are indicated by black boxes above the plot.

