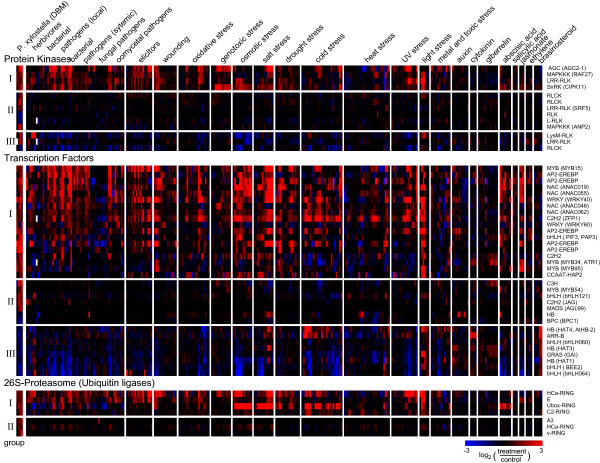
Figure 9.
Meta-analysis of DBM-affected signalling elements. Expression data (normalized intensities) based on publicly available Affymetrix microarray hybridization data were retrieved from the Genevestigator database [55]. All probe sets called absent were set to the mean intensity of these undetectable probe sets for each gene. If replicate experiments were performed the mean intensity of all replicates was calculated. Expression ratios for all treatment experiments were generated using the corresponding control experiments and the log2 transformed ratios were used to generate a heatmap. Each column represents one experiment; each row represents one of the candidate genes as indicated to the right. Bright Red indicates a more than 5.7 fold higher expression in treated plants compared to control plants; bright blue indicates a more than 5.7 fold lower expression. Brief descriptions of the experimental treatments are given on top. Details on each experiment are given in Additional File 4.

