
FIG. 4. Time-course of MTSET inhibition.
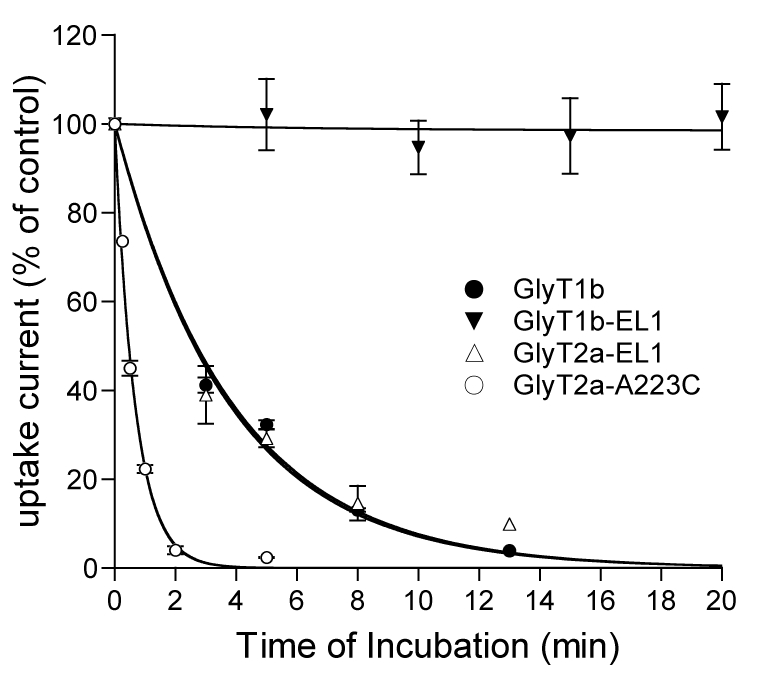
Plot of the glycine-evoked current for GlyT1b (●), GlyT1b-EL1 (▼), GlyT2a-EL1 (△) and GlyT2a-A223C (○) (200 μM glycine in NaCl Ringer) as the function of the time of exposure to 1 mM MTSET in cholineCl Ringer solution (−40 mV holding potential) (n = 3 to 5). Solid lines are fits to the data with single-exponential functions.