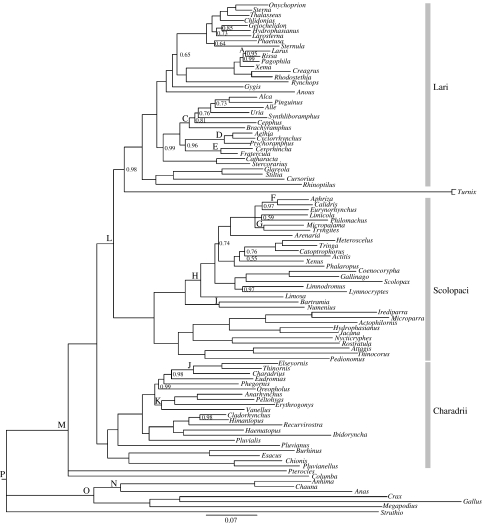
Figure 1.
Bayesian tree for Charadriiformes genera. Letters A to P indicate nodes for which fossil or molecular time constraints were used to estimate divergence times (see table 2 in electronic supplementary material). Numbers at nodes are posterior probabilities (PP), which are not indicated if PP=1.0. Nodes with PP<0.5 are collapsed.

