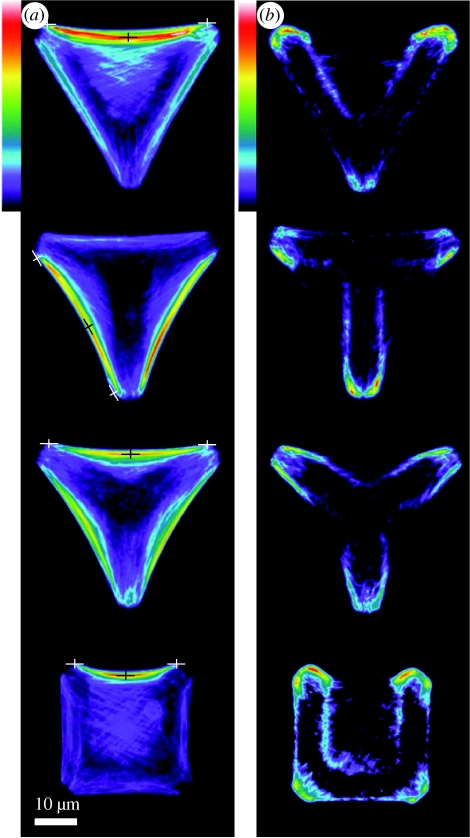
Figure 1.
Experimental images of average (a) actin and (b) vinculin distributions for hTERT-RPE1 cells plated on V-, T-, Y- and U-shaped ligand micro-patterns. The crosses in (a) indicate the endpoints and location of maximum displacement of the non-adhered cell edges used in estimating the radii of curvatures of those cell edges. The length of the triangular edge is 46 μm and a scale bar is included for reference purposes. Reproduced with some modifications from Théry et al. (2006). Copyright © John Wiley & Sons, Ltd.

