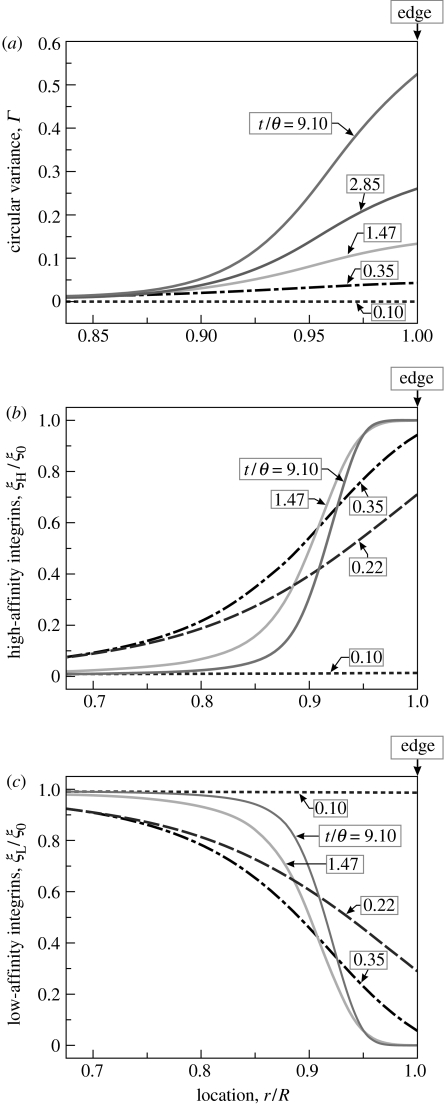
Figure 3.
Predictions of the distributions of the stress-fibre and integrin concentrations along the radius of a circular cell of radius R=17.5 μm on a circular ligand patch of equal radius. The distributions are shown at five selected times. In (a) the stress-fibre concentrations as parametrized by Γ are plotted while (b,c) show the normalized high, ξH/ξ0, and low, ξL/ξ0, affinity integrin concentrations, respectively.

