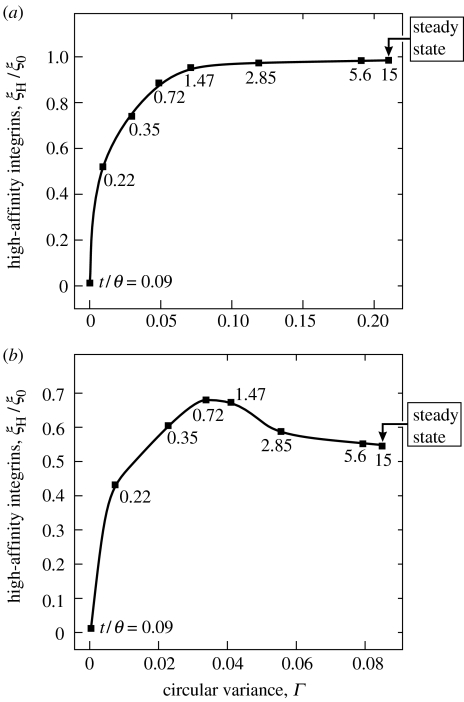
Figure 4.
Predictions of the relationship between the stress-fibre concentration, Γ, and the high-affinity integrin concentration, ξH/ξ0, at two locations, r, near the periphery of the circular cell of radius R=17.5 μm on a circular ligand patch of equal radius: (a) r/R=0.95 and (b) r/R=0.9. The parameter Γ increases monotonically with time and the selected normalized times t/θ are marked adjacent to the square symbols.

