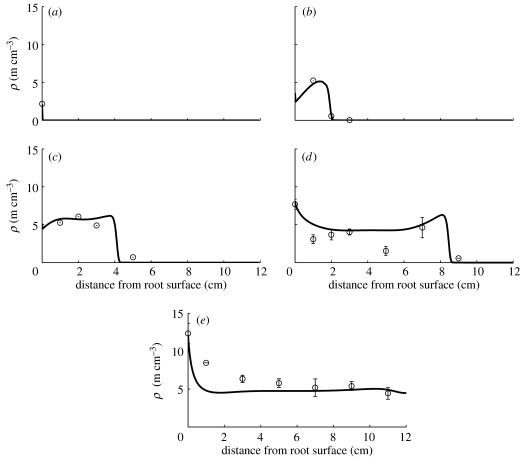
Figure 7.
Plot of the general model in comparison with data for A. laevis. See table 1 for corresponding model parameter values. Numerical solution parameters are the same as given in figure 3 legend. Hyphal length densities at (a) 0 days, (b) 7 days, (c) 14 days, (d) 28 days and (e) 47 days.

