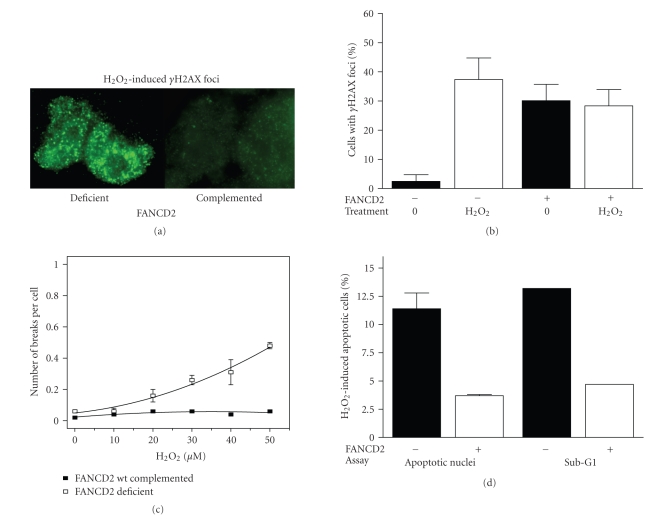
Figure 4.
DNA damage and cell survival as a function of FANCD2 status. (a) Representative images of the formation of γH2AX foci in PD20 versus wild-type complemented cells 30 minutes after completion of H2O2 treatment. (b) Quantification of γH2AX foci response. Data represent means with upper standard error based on two independent experiments. (c) G2-type chromosomal aberrations are expressed as breaks per cell as a function of increasing H2O2 concentration in FANCD2-deficient and wild-type complemented PD20 cells. Data represent means with SEM based on at least three repeat experiments. (d) Apoptosis induction by H2O2 (50 μM) in cells with or without wild-type FANCD2 using fluorescence microscopy to assess apoptotic morphology by DAPI staining and flow cytometric analysis for sub-G1 DNA content. Representative experiments based on the apoptotic response at 24 hours are shown (similar results were obtained at 48 hours and with 25 μM H2O2).

