
Figure 3.
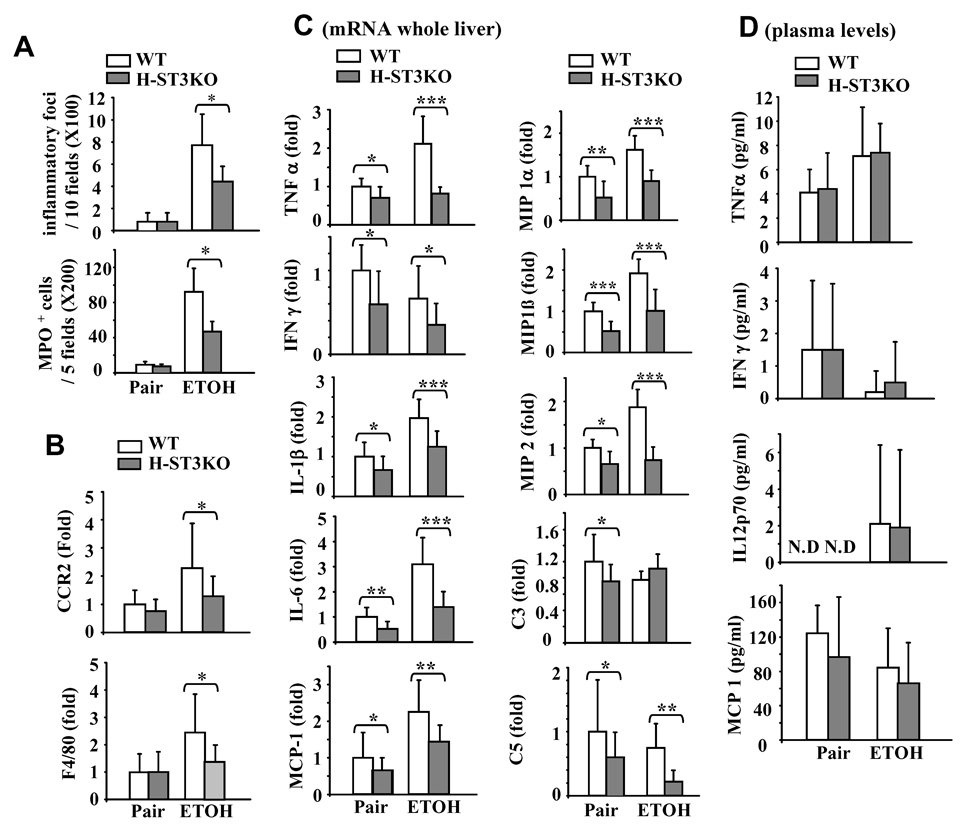
H-STAT3KO mice are resistant to ethanol-induced hepatic inflammation. Feeding of mice for 4 weeks as in Fig. 1. Liver tissues were collected for H&E staining and MPO staining. (A) The number of inflammatory foci and the number of MPO positive cells were counted. (B) Real-time PCR analyses for CCR2 and F4/80 expression in liver. (C) Real-time PCR analyses of cytokine and chemokine expression in the liver. (D) Serum cytokine and chemokine levels. Values represent means ± SD (n=8–10 mice). *P<0.05, **P<0.01, ***P<0.001 denotes significant differences in comparison with corresponding WT groups.