
Figure 4.
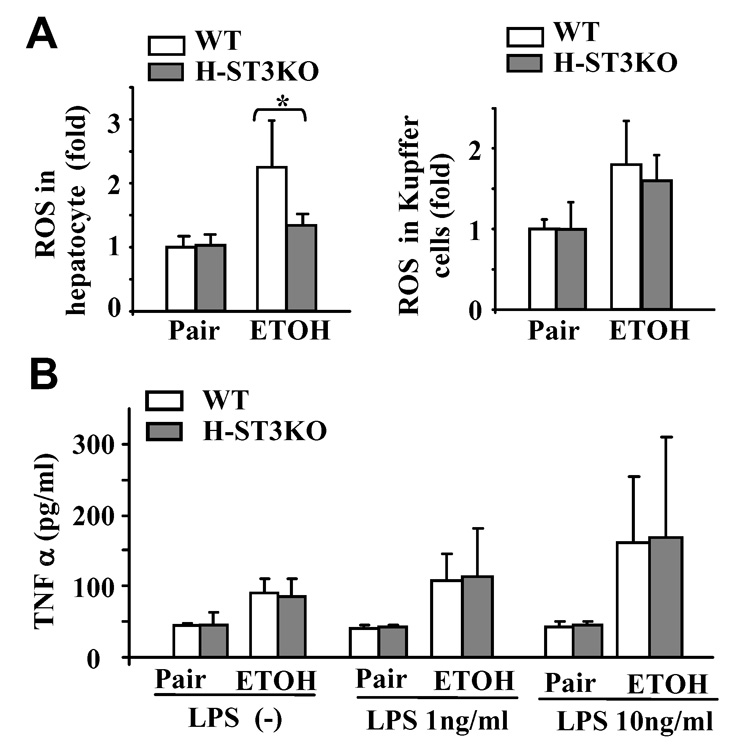
Kupffer cells from H-STAT3KO and WT mice produce similar levels of ROS and respond similarly to LPS stimulation. Feeding of mice for 4 weeks as in Fig. 1. (A) ROS production in hepatocytes and Kupffer from WT or H-STAT3KO mice. (B) Kupffer cells from WT or H-STAT3KO mice were stimulated with LPS for 4 h. TNF-α production was measured. Values represent means ± SD (n=5–6 mice per group.) *P<0.05 denotes significant differences in comparison with WT groups.