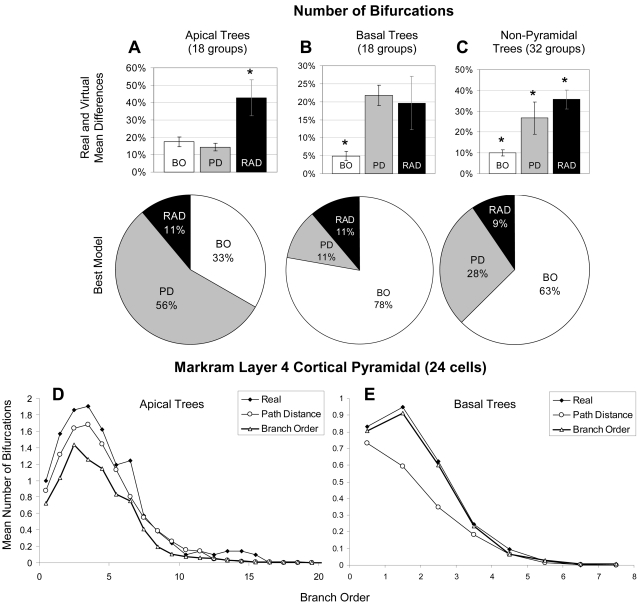
Figure 5. Ability of the models to capture apical and basal number of bifurcations.
(A) Apical trees have their number of bifurcations best captured by Path Distance (RAD = Radius, PD = Path Distance, BO = Branch Order). (B) Basal and (C) non-pyramidal trees have their bifurcation numbers best determined by Branch Order. This may point to different underlying developmental mechanisms between apical and other tree types. (D, E) Sholl-like plots showing bifurcation number as a function of branch order for sample apical (D) and basal (E) groups of cortical pyramidal cells (Markram layer 4, N = 24). Path Distance better captures apical bifurcations while Branch Order better captures basal arbors.

