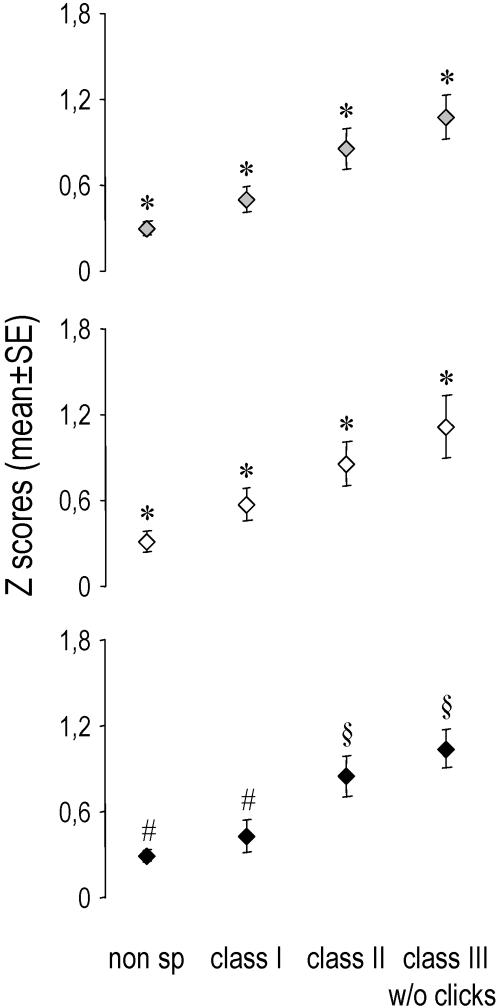
Figure 5. Mean (±SE) Z scores obtained for each class of stimulus.
Grey bars: pooled data of both hemispheres; white bars: data of the left hemisphere; black bars: data of the right hemisphere. * p<0.05 compared to every other groups (PLSD Fisher tests). # p<0.01 compared to class II and class III w/o clicks (PLSD Fisher tests). § p<0.01 compared to non specific and class I (PLSD Fisher tests).

