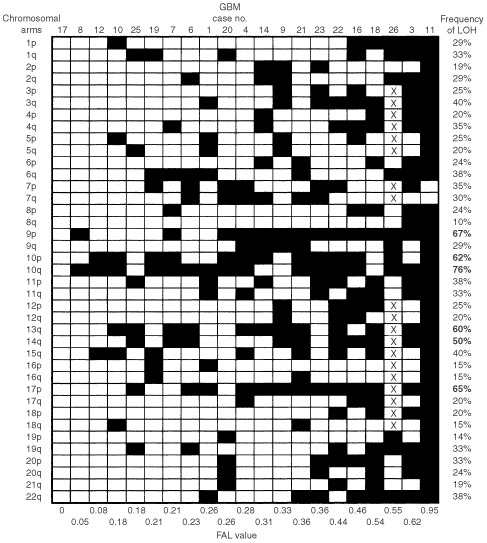
Figure 3.

Summary of allelic imbalances detected in 21 GBM. Case number is indicated on top and fractional allelic loss (FAL) value is shown at bottom. Frequency of LOH is indicated on right, with bold number representing non-random allelic imbalance frequency above the baseline level (47.9%). Filled box represents allelic imbalance detected in specified chromosomal arm and open box indicate chromosomal arm with no detectable allelic imbalance. X, not done.
