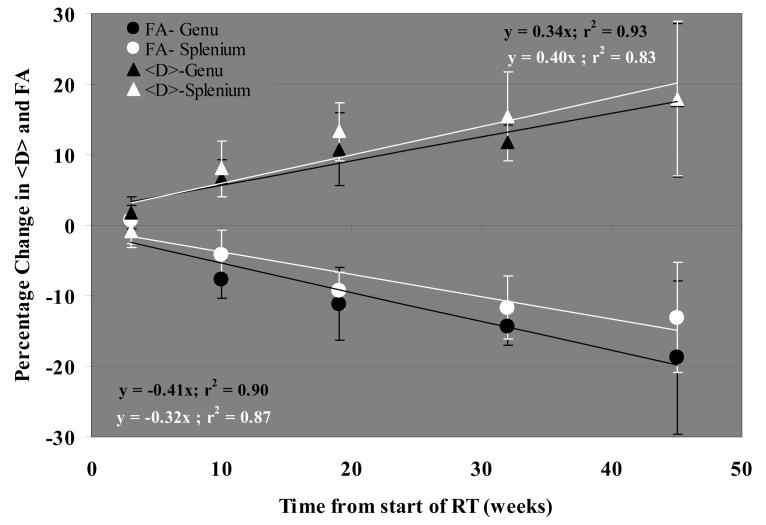
Figure 2.
Temporal profile of the percentage changes in the mean diffusivity, <D>, and fractional anisotropy, FA, in the genu and splenium during and after RT relative to the respective pre RT values. The mean diffusivity, <D>, increased and FA decreased linearly over time both in the genu and splenium. The data is average from all 25 patients in the study, and the error bars represent the standard error of the mean.

