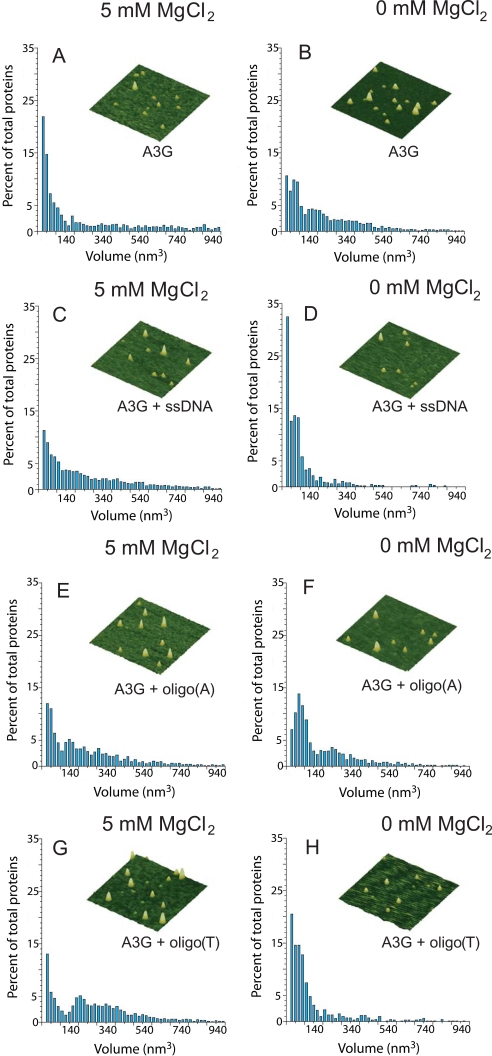
FIGURE 6.
MgCl2 and DNA binding modulate the oligomerization state of A3G. AFM was used to determine the oligomeric state of A3G alone in the presence of 5 mm MgCl2 (A), alone in the absence of MgCl2 (B), in the presence of ssDNA and 5 mm MgCl2 (C), and in the presence of ssDNA and absence of MgCl2 (D). The oligomeric state of A3G was also determined in the presence of oligo(A) and 5 mm MgCl2 (E), in the presence of oligo(A) and absence of MgCl2 (F), in the presence of oligo(T) and 5 mm MgCl2 (G), and in the presence of oligo(T) and absence of MgCl2 (H). The 70-nt ssDNA was added to 200 nm final concentration. A3G was added to 100 nm final concentration. Volume distributions of A3G are plotted against the percentage of total proteins. Total proteins counted were as follows: 1354 (A), 3168 (B), 4231 (C), 663 (D), 1563 (E), 1224 (F), 6738 (G), and 706 (H). Representative AFM images of A3G are shown for each condition. Images are 300 × 300 nm with a height scale of 5 nm.

