Figure 4.

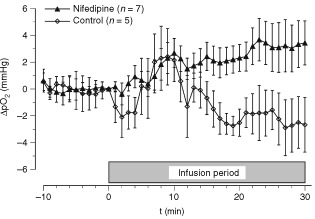
Changes of mean tumour pO2 during isolated limb perfusion upon application of nifedipine compared to the pO2 value immediately prior to the commencement of drug infusion. Data represent mean±s.e.m. (n=number of tumours investigated).

Changes of mean tumour pO2 during isolated limb perfusion upon application of nifedipine compared to the pO2 value immediately prior to the commencement of drug infusion. Data represent mean±s.e.m. (n=number of tumours investigated).