Figure 2.
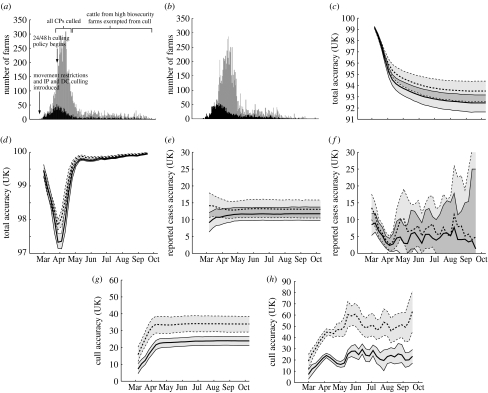
Model and data comparison for the entire country. (a) The daily number of farms that report infection (black) and farms that were culled (grey), together with the timings of national control measures for the 2001 epidemic. (b) Similar results from a single replicate model simulation, starting with the conditions on 23 February 2001. (c–h) Accuracy (solid lines) and associated repeatability (dashed lines) results (together with 95% CIs) for various time intervals and various farm types. If t is the time on the x-axis, the accuracy results are (c) accuracyall(23 February, t), (d) accuracyall(t, t+14), (e) accuracyreported(23 February, t), (f) accuracyreported(t, t+14), (g) accuracyculls(23 February, t), (h) accuracyculls(t, t+14). At least 2500 simulations were used to determine each data point. Regional plots, for Cumbria, Devon, the rest of England, Wales and Scotland, are shown in the electronic supplementary material.

