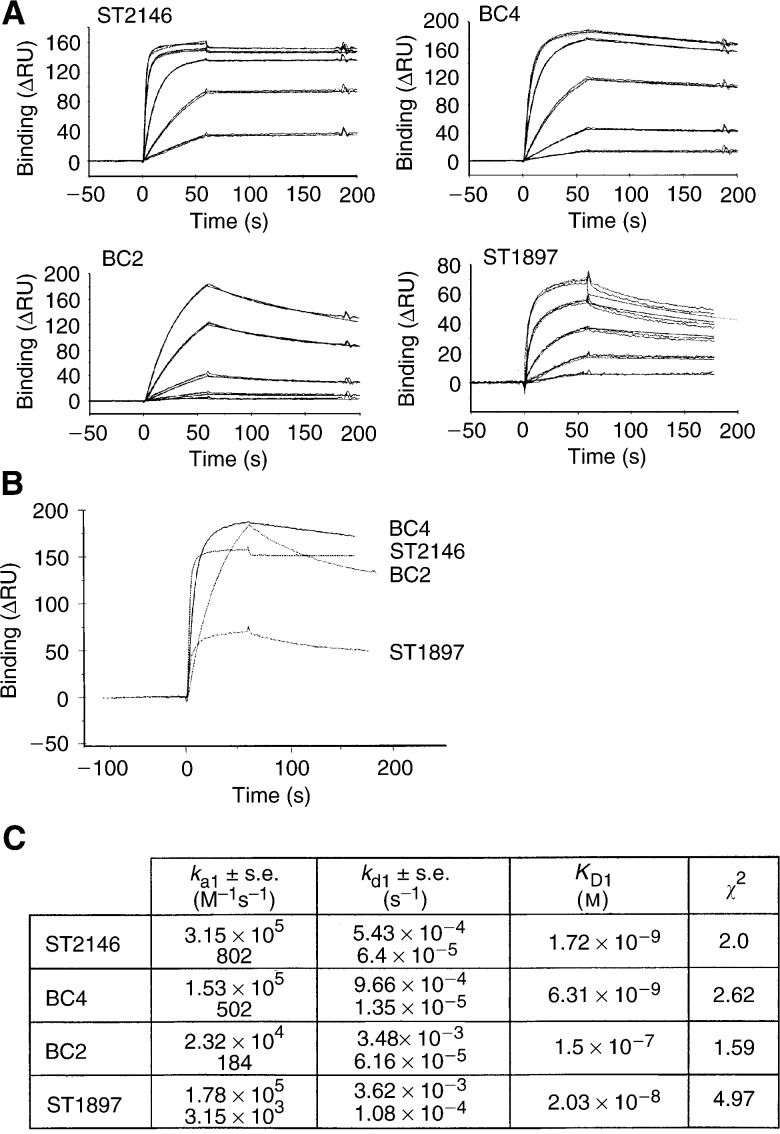
Figure 5.
BiaCore analysis of ST2146, BC4, BC2 and ST1897 on tenascin-coated chip. (A) Sensograms of indicated Mabs. All antibodies were injected at concentrations of 500, 250, 62.5, 15.6 and 3.9 nM for 60 s. The dissociation rates of the Mabs were determined over a time of 120 s. (B) Comparison of the binding and dissociation of the indicated Mabs at an injected concentration of 500 nM. (C) ka1, kd1, KD1 and χ2 of the fitted curves.

