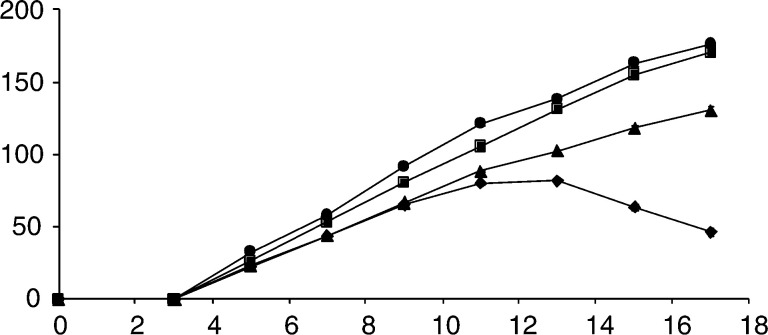
Figure 1.
Growth rates of implanted tumours following subcutaneous injection of 5 × 10⁶ cells at t=0 days. (•) EL-4 tumours (n=30); (▪) E.G7-OVA tumours, arising from cells implanted at nominal passage numbers 13 – 20 (n=28); (▴) E.G7-OVA tumours arising from cells implanted at nominal passage numbers 7 – 12 (n=26); (♦) regressive E.G7-OVA tumours (18 arising from cells implanted at nominal passage numbers 7 – 12 and five arising from cells implanted at nominal passage numbers 13 – 20). The symbols represent the mean±s.e.m. of the volumes reported as the product of the two largest perpendicular diameters. Where they are not visible, the error bars lie within the symbols.

